6 Best Technical Indicators for Intraday & Swing trading to build a complete trading setup in 2022 are – 1. Bollinger Bands 2. EMA 3. Stochastic 4. MACD 5. ADX 6. Momentum
Why Technical Indicators?
Have you learned from your experiences that what is the best way of day trading? Is your study fruitful during day-trading as a professional trader? If not, and even you are beginner in the world of Stock Market, you must read and follow this blog.
I am sure that this best way of day-trading approach using technical indicators will give your day-trading a new shape.
You should know that the fundamental factors of a country are the core of a stock market and its prices. But it can’t be realized during day-trading of day-to-day market.
During day-trading only technical developments and sentiments are dominant that govern the market and its move.
In other words, technical developments help traders to decide about further movement of prices whereas sentiments indicate the continuation of a trend or its reversals. However, these reversals may recur many times in a single day.
You can find these reversal levels using our marvelous Stock Calculator. Also, you can read the post, Best Strategy for Intraday Trading, to clear the concept behind this calculator.
Fortunately, we have great tools i.e., Technical Indicators on Charts to deal with these both technical developments and sentiments.
Technical analysis of charts make your day trading much smoother and easier by using a good combination of technical indicators. Risk-reward ratio improves to a greater extent surprisingly.
Here you should pay maximum attention to learning this best approach. We will discuss related terms briefly on applications point of view.
6 Best Technical Indicators for Day-trading
Best Trading Indicators
1. Bollinger Bands (BB)
Bollinger Bands are used to determine overbought and oversold levels. Overbought zone is where the price reaches the top of the band and Oversold zone is where the price reaches the bottom of the band.
Prices oscillates almost between these two zones. There is also a middle line represents moving average of prices. It acts like a resistance (while going up) or support (while going down).
2. Exponential Moving Average (EMA)
The exponential moving average is used to identify buying and selling opportunities calculated on exponential scale. It is the average price of the latest number of days mentioned.
Most importantly, the combination of EMAs alone give a superb signal for buying and selling in day-trading. So, in coming days I will post it in details.
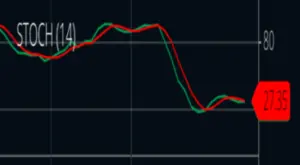
3. Stochastic
Stochastic is my favourite technical indicator. It is also used to determine overbought and oversold levels.
It oscillates between 0 and 100. Above 80 is considered overbought and below 20 is oversold conditions.
In layman terms there are two lines fast and slow. The fast line is shown in green here.
4. Moving Average Convergence and Divergence (MACD)
Moving Average Convergence Divergence (MACD) is a trend-following momentum indicator calculated by subtracting the 26-days EMA from the 12-days EMA.
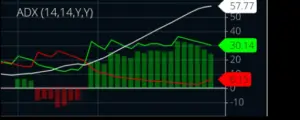
5. Average Directional Index (ADX)
Average directional index (ADX) is used to determine the strength of price-trend either upward or downward.
It is my second most favourite technical indicator. Because it gives a clear-cut picture through the appearance of continuous positive or negative Bars where you can buy or sell without any tension.
6. Momentum
Momentum shows trend direction and measures how quickly the price is changing by comparing current and past prices.
How to Set Technical Indicators on Chart
Firstly, you should choose a trading platform like zerodha, angelbroking or whatever you like or already you have.
Secondly, select a time-frame and chart-style on the chart. In chart-style select Candle ( you may also select Heikin Ashi ). And for time-frame select either 5 minutes or 15 minutes.
Now, settings for technical indicators can be done one-by-one. Try to go with default settings available on chart otherwise follow the checklists.
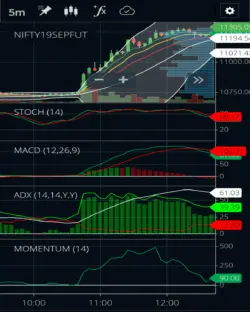
chart by zerodha
The checklists:
- Bollinger Bands 20-period with 2 standard deviations; moving average type- simple
- Moving Average 13-period, type- exponential, color- red
- Moving Average 8-period, type- exponential, color- yellow
- Moving Average 5-period, type- exponential, color- green
- Stochastic 14-period, Fast line- green color, Slow line- red color, opt for show zone
- MACD 12, 26, 9-periods, MACD- green color, Signal- red color
- ADX/DMS 14-period with smoothing period- 14, opt for series and histogram, Positive Bar- green color, Negative Bar- red color
- Momentum 14- period.
Please comment if you face any problem with chart setting.
How to Trade
Once when you set your chart for any stocks or instruments according to the checklists, save it as your default settings.
Congratulations!! You have taken a very important step.
Take a Trade (Entry)
Entry means when you Go-Long (Buy) or Short-Sell (Sell firstly).
Before entry you have to be in wait and watch mode. Till then keep checking the chart development of other stocks/instruments at their default settings.
And, finally, buy a financial instrument (index, share, future, option, Commodities or Currencies) only when you see below mentioned all occur almost simultaneously:
- that the price is going above the midline of the Bollinger band
- that the 5-day EMA is going above the 13-day-EMA
- that the Fast line of the Stochastic (green) has already crossed the Slow line or is crossing upward (Advance Indicator)
- that the direction of +DI of ADX is sharp upward above 20 and most importantly the behaviour of Positive Bars. It starts to appear during trend reversal from downside to upside. Also its length becomes larger and larger.
- For downsizing risk you can also watch MACD and Momentum. Both should trending-up.
In the similar fashion you can Sell a financial instrument only when
- the price is going below the midline of the Bollinger Bands
- 5 days-EMA is crossing below 13-days-EMA
- the Fast line (green) of the Stochastic has already crossed the Slow line or is crossing downward (Advance Indicator)
- ADX -DI direction is upward above 20 and most importantly the behaviour of Negative Bars. It starts to appear during trend reversal from upside to downside . Also its length becomes larger and larger.
- For downsizing risk you can also watch MACD and Momentum. Both should trending-down.
Exit from a Trade (square-off)
Exit means where you close your position. Exiting a trade is equally important. And especially this situation becomes more difficult when you are in good profits. But remember you have to keep your greed in control.
Some good suggestions where you can close your position:
- make your own rule to exit, Or
- close your position according to this approach, i.e. If you have bought, close the position when the selling indication arrives and also follow its vice-versa. But here you may regret losing some profit, Or
- Most important, keep an eye on the Stochastic. If you have bought, close your position when it reaches around 80. And if you have sold initially, then close your position when it comes around 20. If you do not exit for more profit then you should use stop-loss.
- You can also square-off your position when you feel that the bar (positive or negative according to the case) of ADX is the longest one during the trend.
- And, finally, my calculator will tell you the next target where you can exit.
Conclusion
In conclusion, I want to clear you some trading aspects.
- Initially it seems difficult to trade in this way. But for overall profit, you will have to maintain the trading discipline, otherwise here the chances of loss are high.
- Be sure that after practice it will become easy for you. Which will always keep you optimistic about the share market. And you will also be able to make money.
- At the first sight you can only see the Stochastic and ADX patterns. Use another indicators for further confirmation.
- On chart, Smaller time-frame leads to more sensitive signals but less reliable. Larger time-frame gives more reliable but less frequent lagging signals. Therefore, one should follow 15-minutes or 30-minutes time-frame for intraday trading.
- Heikin Ashi identify a given trend more easily. Also reversal points easier to spot but since the Heikin-Ashi technique uses price information from two periods, a trade setup takes longer to develop and that’s why this style is not responsive enough to be useful for day-trading.
You may prefer these trading platforms for better technical charts and technical indicators-


