
![Is Palantir Stock a Buy or Sell? [March, 2023]](https://subhmantra.com/wp-content/uploads/2023/02/Is-Palantir-Stock-a-Buy-or-Sell-640x853.jpg)
Palantir Technologies (PLTR), incorporated in 2003, is a data analytics company based in Denver, Colorado.
The company provides software solutions primarily to the intelligence community and governments in the United States.
Although if we look at the annual results of the company, we find that the financial condition of Palantir has relatively improved in the last four years.
Yet its stock has experienced tremendous volatility since its debut in 2020. In fact, since hitting a high of $45 in January 2021, the stock has been trading steadily lower.
Before moving on to the technical analysis and probable targets of Palantir stock, let us brief ourselves about market outlook towards the company.
Market outlook for Palantir Technologies
- Palantir Technologies is one of the world’s largest data analytics companies with a market capitalization of around $17 billion.
- Although it primarily serves government organizations, it is also expanding commercially into health, banking, energy, and other sectors.
- Palantir’s ability to analyze vast amounts of complex and unstructured data makes it vital to government agencies dealing with national security threats.
- The company has grown through strategic alliances with IBM for AI-powered supply chain management solutions and acquisitions such as C3.ai.
Palantir’s stock recently saw a surge of over 20% after its first profitable quarter (reported on February 13, 2023).
However, last week it fell by 12.7% after a Wall Street analyst cautioned about the expiration of large government contracts in 2023, including three out of the company’s four most significant contracts.
Palantir’s revenue model relies heavily on long-term individual contracts, making its growth unpredictable and its reliance on government contracts risky.
Although Palantir’s CEO, Alex Karp, has expressed confidence in the company’s ability to retain government contracts.
But if Palantir loses a significant contract, it could harm its short-term results and GAAP profitability goals.
Palantir Stock Chart Analysis
Palantir stock’s IPO opened at $7.25 on September 30, 2020, and after hitting an October 2020 low of $8.90, the share price rose to $45 in January 2021.
But the stock has made an all time low of $5.92 in December 2022 itself. So as a rough estimate it can be said that the share price is well below its all-time high of $45 and there is still room for the stock to grow.
Where Palantir stock price can go from here, we can know it in two ways – by fundamental analysis of the company and secondly by chart analysis.
But to understand where the stock is headed now, we are here to analyze the PLTR stock technically.
To get a long term perspective, we first examine the stock price trend and chart patterns on the monthly charts.
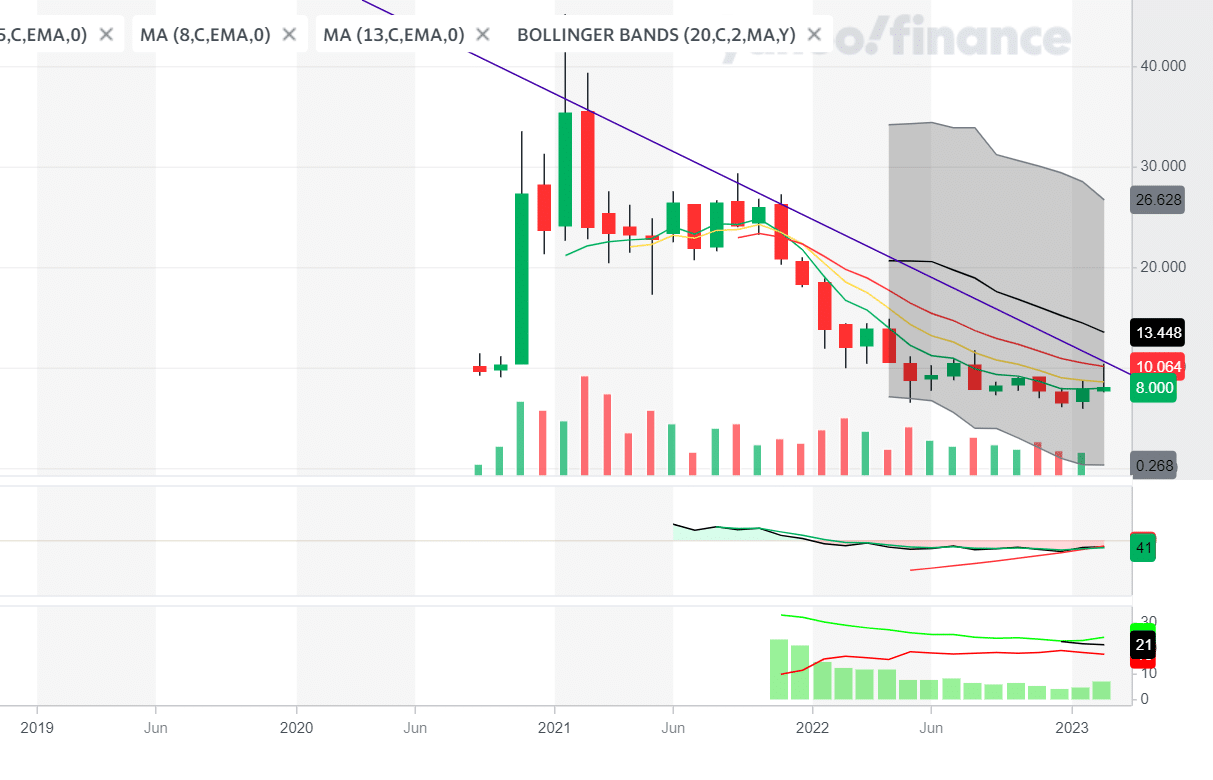
Some findings are –
- The pattern demonstrates a continuous downtrend, characterized by lower highs and lower lows.
- By connecting the February and November 2021 candlestick highs, we can see a clear down trendline that recently acted as resistance at $10.31.
- For the stock to regain upward momentum, it must close above this trendline on a monthly basis.
However, based on my personal experience, if the stock closes where it is in February, it may see an upward movement in the next one to two months.
As mentioned earlier in the Shopify stock forecast under the category Stocks, an explosive chart ahead, Palantir’s chart is not continuing the same vein.
PLTR stock is still bullish on the weekly chart. The good news is that the price has been trading above the 20-EMA continuously for 11 weeks and the Bollinger Bands are getting narrower.
$9.075 to $9.342 is a strong resistance zone for the stock. The share price has so far been unable to give close above the trendline in the short term on the daily chart.
It would be better to keep monitoring the trendline.
Read this also-
Palantir Stock Forecast 2025
While 12-Month Price Forecasts for Palantir Technologies are available on the Internet (CNNMoney, Tipranks), with an average target of 8.00 and a range of estimates between 5.00 and 15.00.
But we will use stock market calculator to show you the possible scenarios for the stock price. This will help you make better decisions based on the current market conditions.
According to this calculator PLTR stock price volatility for 2023 is 1.195. We should use a strict stop-loss at $6.47 to limit losses.
| Target1 | Target2 | Target3 | Target4 | |
| only above $7.75 during UPTREND | 7.90 | 9.46 | 12.63 | 20.18 |
| only below $5.41 during DOWNTREND | 5.30 | 4.43 | 3.32 | 2.08 |